
To say it’s been a bad 12 months for home sales would be a massive understatement.
Today, the National Association of Realtors (NAR) reported that sales of existing homes fell to the lowest level in nearly 30 years last month.
So if you’re wondering if something broke after the Fed raised interest rates 11 times, look no further than the housing market.
Per NAR, sales of existing homes fell to an annual rate of 4.06 million in December, the lowest total since 1995.
For perspective, many real estate agents today weren’t even born in 1995, nor were the loan originators helping buyers get the mortgages.
What is behind the fall in home sales?
While home sales did indeed tick up to close out 2024, the annual volume was pretty abysmal and the worst since the mid-1990s.
Driving the lack of home sales has been two main things. Lack of inventory to sell and lack of affordability.
And it can be argued that mortgage interest rates are behind much of it, regardless of whether it is the lock-in of mortgages that causes homeowners to stay put.
Or the record low mortgage rates in 2021, which led to investors and others gobbling up what little was out there and refusing to let go.
Now that 30-year fixed mortgage rates are around 7%, it has become prohibitive for new buyers to enter the fray.
NAR noted that completed transactions, which include single-family homes, townhomes, condominiums and condominiums, increased 2.2% from November and 9.3% from December 2023.
It was the third month of year-over-year gains, but still not enough to bring the annual total up to any meaningful degree.
Granted, the annual rate barely exceeded four million, so it could have been worse, I suppose. But it was definitely not good.
The NAR revealed that total housing inventory at the end of December was just 1.15 million units, down 13.5% from November but up 16.2% from a year ago (990k).
That meant unsold inventory at the current pace of sales was just a 3.3-month supply, down from 3.8 months in November and up marginally from 3.1 months in December 2023.
House prices continue to rise despite a slump in sales
As we all know, house prices are driven by supply and demand. When there is less of something available, the price rises, provided there is more demand than supply.
While demand has also been dampened by a lack of affordability, it is still not weak enough to offset further home price gains in most markets, hence the nationwide appreciation figures.
Speaking of which, the median price for an existing home rose to a record high of $407,500 in 2024, up a whopping 6.0% from $381,400 a year ago.
And it wasn’t just driven by the Northeast or some other hot area of the country. All four US regions had year-over-year price increases.
The Northeast was strongest with home prices up 11.8% from last year, followed by the Midwest (+9.0%), the West (+6.0%) and the South (+3.4%).
Many people believe that there is an inverse relationship between home prices and mortgage rates, but it is really a selling relationship.
When mortgage rates are lower, transactions are higher. But when prices rise, you see home sales slow.
However, this does not mean that house prices will fall. They can and will continue to rise as long as supply does not increase.
In general, anything from 4-5 months of supply is considered a healthy, balanced housing market.
We continue to see supply in the 3-month range, which is simply not enough, even if it prevents house prices from falling.
Why it’s good to see home sales slowing
While lower home sales are obviously bad news for a number of reasons, namely that the economy is often driven by real estate, there is one positive.
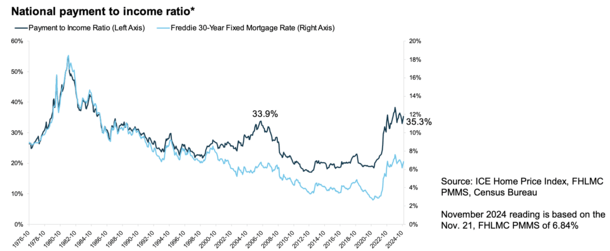
We know that housing affordability today has rarely been worse than the 1980s (remember those double-digit mortgage rates?).
Home buying conditions are currently less favorable than what we saw at the height of the housing boom in 2006.
At that time, the national payment-to-income ratio reached 33.9% per ICE. In November it was an even higher 35.3%.
Much of that has been driven by significantly higher mortgage rates, which rose from around 3% to as high as 8% in 2023, before falling to around 7% currently.
As mentioned, house prices have continued to rise despite this, albeit at a slower pace.
The combination of a higher asking price coupled with a mortgage rate that is more than double what it once was has been a one-two punch.
However, the market has responded appropriately. Back in 2006, home sales continued to falter.
Why? Because we had absolutely no protection in the mortgage world. Instead, we adapted by offering riskier and riskier loan products along with disclosed income and no-doc underwriting.
Today, much of that is gone thanks to changes made after the mortgage crisis of the early 2000s.
You can thank the ATR/QM rule for eliminating a lot of the things that have made today’s housing market much healthier.
Sure, home sales will continue to suffer, but at least we don’t have new loans and homes going to people who can’t afford them.
Read on: The housing market’s risk factors are very different today.

Before creating this site, I worked as an account manager for a wholesale pawn shop in Los Angeles. My hands-on experience in the early 2000s inspired me to start writing about mortgages 18 years ago to help potential (and existing) homebuyers better navigate the home loan process. Follow me on Twitter for hot takes.